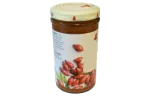
Jam or jelly (rosehip)
Bakery ProductsOxalate
N/A
No dataPurines
5 mg
LowSodium
5 mg
LowValues per 100 g · Grading: green < threshold, yellow ≤ upper, red above (kidney stone / gout standards)
Full Nutrition Profile
Typical portion: 20 g. Values scale to the portion, exactly like the app.
Moderate Oxalate
%DVKidney stone patients focus on oxalate and mineral balance
| Calcium | 14.2 mg | 1% |
| Sodium | 1 mg | 0% |
| Salt | 2.5 mg | 0% |
| Fructose | 1.8 g | |
| Water Content | 5.3 g |
Stone and gout risk assessment: ; Low in purines.
Gout & Uric Acid
%DVGout/hyperuricemia patients focus on purines and metabolic indicators
| Purines | 1 mg | 0% |
| Fructose | 1.8 g | |
| Sodium | 1 mg | 0% |
| Salt | 2.5 mg | 0% |
| Vitamin C | 10.2 mg | 11% |
| Water Content | 5.3 g |
Stone and gout risk assessment: ; Low in purines.
Basic Nutrition
%DVGeneral nutrition information
| Energy | 55.4 kcal | 3% |
| Protein | 0.1 g | 0% |
| Total Fat | 0 g | 0% |
| Carbohydrates | 12.5 g | 5% |
| Dietary Fiber | 1.7 g | 6% |
| Water | 5.3 g | |
| Sugars | 10.1 g | |
| Added Sugars | 8.4 g | 17% |
| Starch | 0 g | |
| Sodium | 1 mg | 0% |
This food provides 277 kcal per 100g, very low in protein, almost fat-free, high in carbohydrates (62.3g), primary energy source. Rich in dietary fiber (8.7g), supports digestive health.
Glycemic Index
Diabetes/blood sugar control focus on GI values and related sugars
| Glycemic Index | 63 |
| Glycemic Load | 39.3 |
| Fructose | 1.8 g |
| Glucose | 2.4 g |
| Sucrose | 5.8 g |
| Cholesterol | 0 mg |
| Fiber | 1.7 g |
Glycemic analysis: Moderate glycemic index (GI=63), moderate impact on blood sugar.
Fatty Acids & Cholesterol
%DVCardiovascular health focus on fat composition
| Saturated Fat | 0 g | 0% |
| Monounsaturated Fat | 0 g | |
| Polyunsaturated Fat | 0 g | |
| Cholesterol | 0 mg | 0% |
| EPA | 0 g | |
| DHA | 0 g |
Fatty acid profile: Low in saturated fat; Contains monounsaturated fats (0.0g), beneficial for cardiovascular health; Contains polyunsaturated fats (0.1g), essential fatty acids; Cholesterol-free.
Vitamins Profile
Main vitamin content overview
| Vitamin C | 10.2 mg |
| Vitamin D | 0 μg |
| Vitamin E | 0.2 mg |
| Vitamin K | 3.4 μg |
| Vitamin B1 | 0 mg |
| Vitamin B2 | 0 mg |
| Vitamin B3 | 0 mg |
| Vitamin B5 | 0 mg |
| Vitamin B6 | 0 mg |
| Vitamin B12 | 0 μg |
| Folate | 0 μg |
Vitamin analysis: Rich in vitamin C (51.0mg), antioxidant properties, boosts immunity; No vitamin B12 (characteristic of plant-based foods); Contains some vitamin E.
Minerals Profile
Main mineral content overview
| Calcium | 14.2 mg |
| Iron | 0 mg |
| Magnesium | 4.6 mg |
| Phosphorus | 11.6 mg |
| Potassium | 33 mg |
| Sodium | 1 mg |
| Zinc | 0 mg |
| Copper | 0.1 mg |
| Manganese | 0.1 mg |
| Iodine | 0 μg |
Mineral analysis: Contains some calcium; Low in iron; Low in potassium; Low in sodium, suitable for low-sodium diets.
Search 1,300+ Foods in the App
Scan barcodes, save your personal safe-list and get AI nutrition advice — everything from this database, in your pocket.
Free to download · No credit card required · iOS & Android